
There is a comforting little ritual fantasy managers perform every August.
Two running backs are sitting there. Similar talent. Similar workload. Similar price.
One plays for an offense we think might be terrible.
The other plays with a good quarterback, a good offensive line, a competent coaching staff and enough projected touchdowns to make us feel like adults making a responsible financial decision.
Obviously we take the second guy.
Good offense. More touchdowns. More scoring opportunities. Safer pick.
Very sensible.
Unfortunately, fantasy drafts are markets, and markets have an annoying habit of noticing the obvious stuff too.
So we tested it.
Across 535 drafted running back seasons from 2015 through 2025, the question was simple:
After accounting for what fantasy managers already paid, did running backs on projected good offenses actually return more value?
The answer was basically no.
And I find this deeply inconvenient.
Good Offenses Did Score More Fantasy Points
First, the part everyone expects.
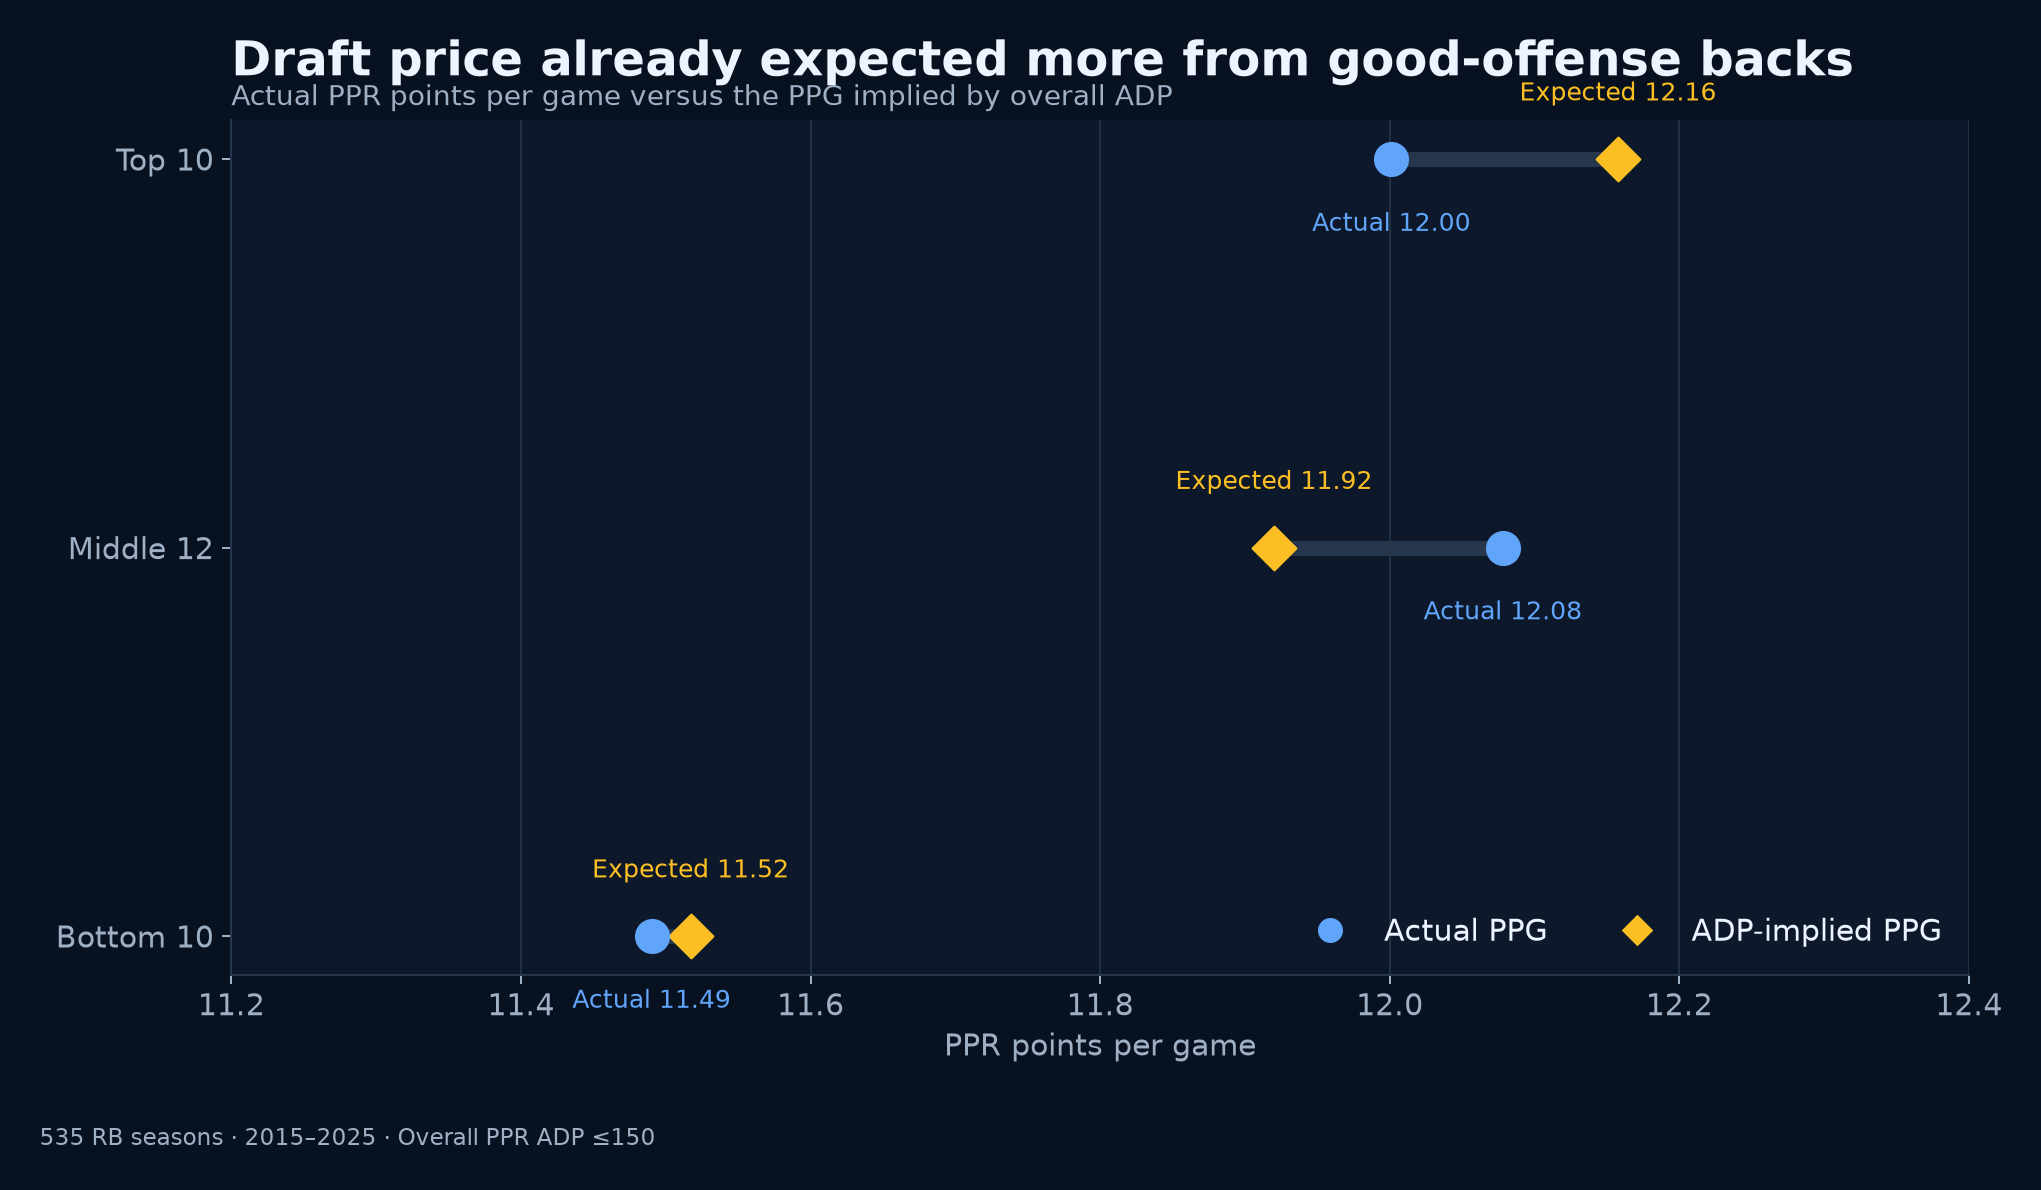
Running backs on teams ranked in the preseason top 10 by archived win-total expectations averaged 12.00 PPR points per game.
Running backs on projected bottom-10 teams averaged 11.49.
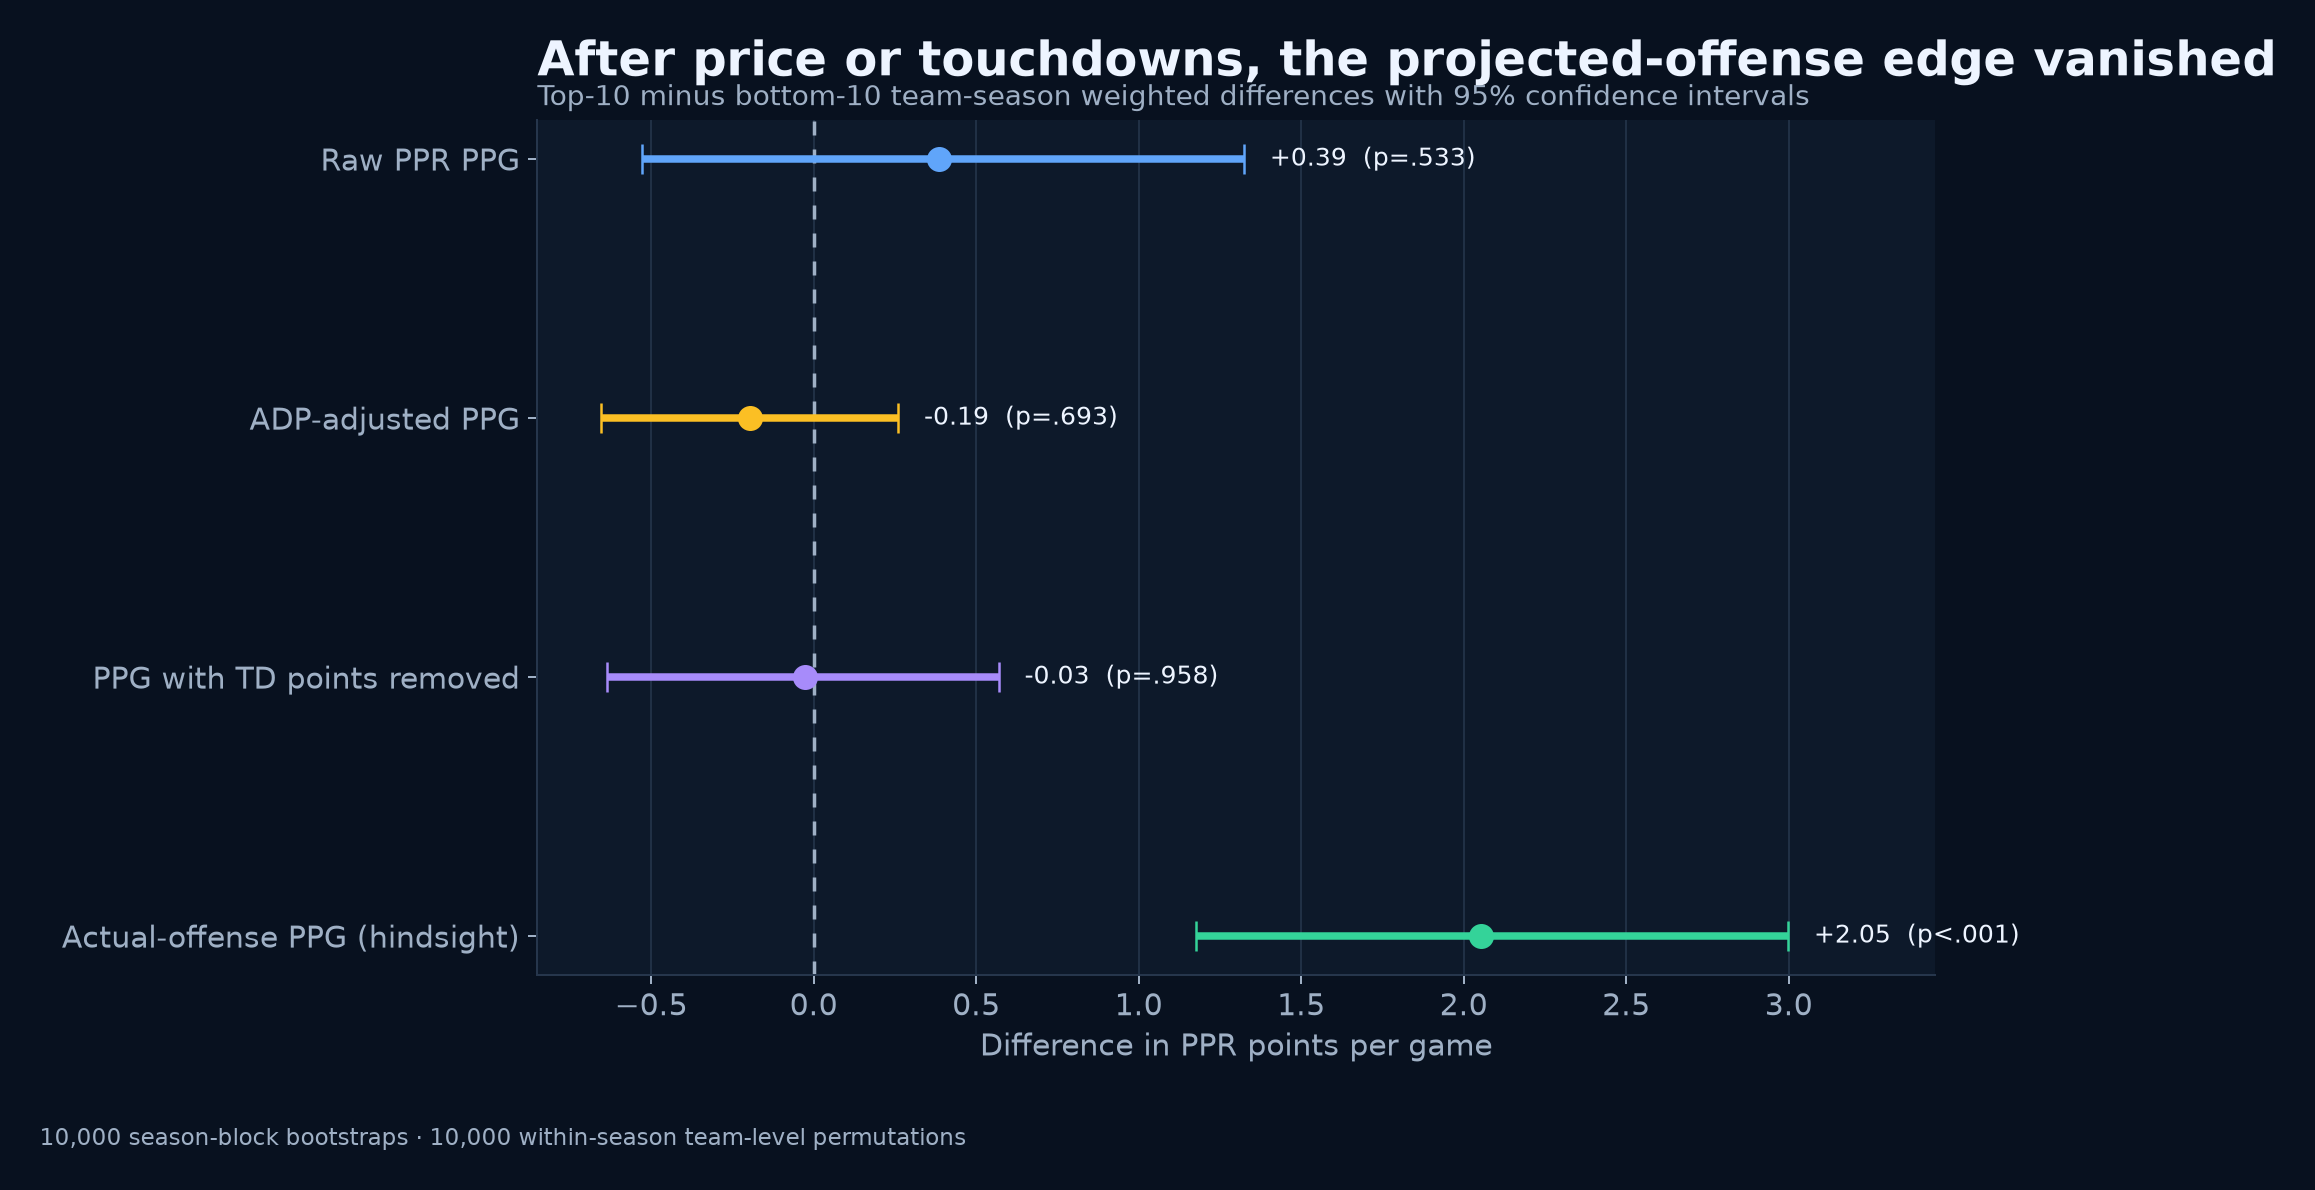
When weighted at the team-season level, the advantage was about 0.39 PPG.
Great. Case closed. Draft running backs attached to good offenses. We can all go home and spend the next three weeks pretending preseason coach quotes matter.
Except there was another number.
The average overall ADP:
| Projected team tier | Average ADP | PPR PPG | Top-12 finish | Beat RB ADP by 12+ |
|---|---|---|---|---|
| Top 10 | 63.9 | 12.00 | 24.6% | 15.6% |
| Middle 12 | 66.3 | 12.08 | 25.1% | 16.1% |
| Bottom 10 | 71.3 | 11.49 | 19.7% | 15.3% |
Fantasy managers paid roughly seven overall picks more for running backs attached to projected top-10 teams.
That changes the question.
We aren't asking whether better offenses produce more fantasy points.
They do.
We're asking whether they produce more points than their draft price already expects.
And there the advantage disappeared.
ADP Ate the Entire Advantage
To account for price, every RB season was compared against an expected PPG curve based on overall ADP. The curve was fitted out of sample, leaving the player's entire season out.
Projected top-10 offense RBs finished 0.19 PPG worse relative to expectation than bottom-10 offense RBs on a team-weighted basis.
The 95% confidence interval ran from −0.65 to +0.26, and the permutation test came back at p=.693.
Translation for those who did not spend their Saturday morning recreationally reading bootstrap methodology:
There is no convincing evidence that drafting an RB on a projected good team gave you extra value after accounting for his price.
The offense advantage existed.
You just paid for it.
This is fantasy football's version of paying $19 for an airport sandwich because technically, yes, there is turkey on it.
The market wasn't wrong. It correctly recognized that better teams could produce better fantasy environments.
It just put that information into the price.
The Touchdown Fairy Was Doing Most of the Work
Then things got weirder.
Take touchdowns away.
Not literally. Roger Goodell has enough problems.
We recalculated scoring after removing the six fantasy points awarded for every rushing and receiving touchdown.
The +0.39 PPG advantage for backs on projected top-10 teams became −0.03 PPG.
Gone.
The supposed good-offense advantage was essentially a touchdown advantage.
Not more receptions.
Not some enormous yardage advantage.
Touchdowns.
That matters because touchdowns are exactly what fantasy managers imagine when they pay the good-offense premium.
More red-zone trips. More goal-line opportunities. More Sunday afternoons where your running back falls forward from the 1-yard line and you briefly believe life has meaning.
The logic isn't wrong.
The price is the problem.
The More Important Question Might Be: Does He Catch Passes?
This was the finding that changed how I thought about the study.
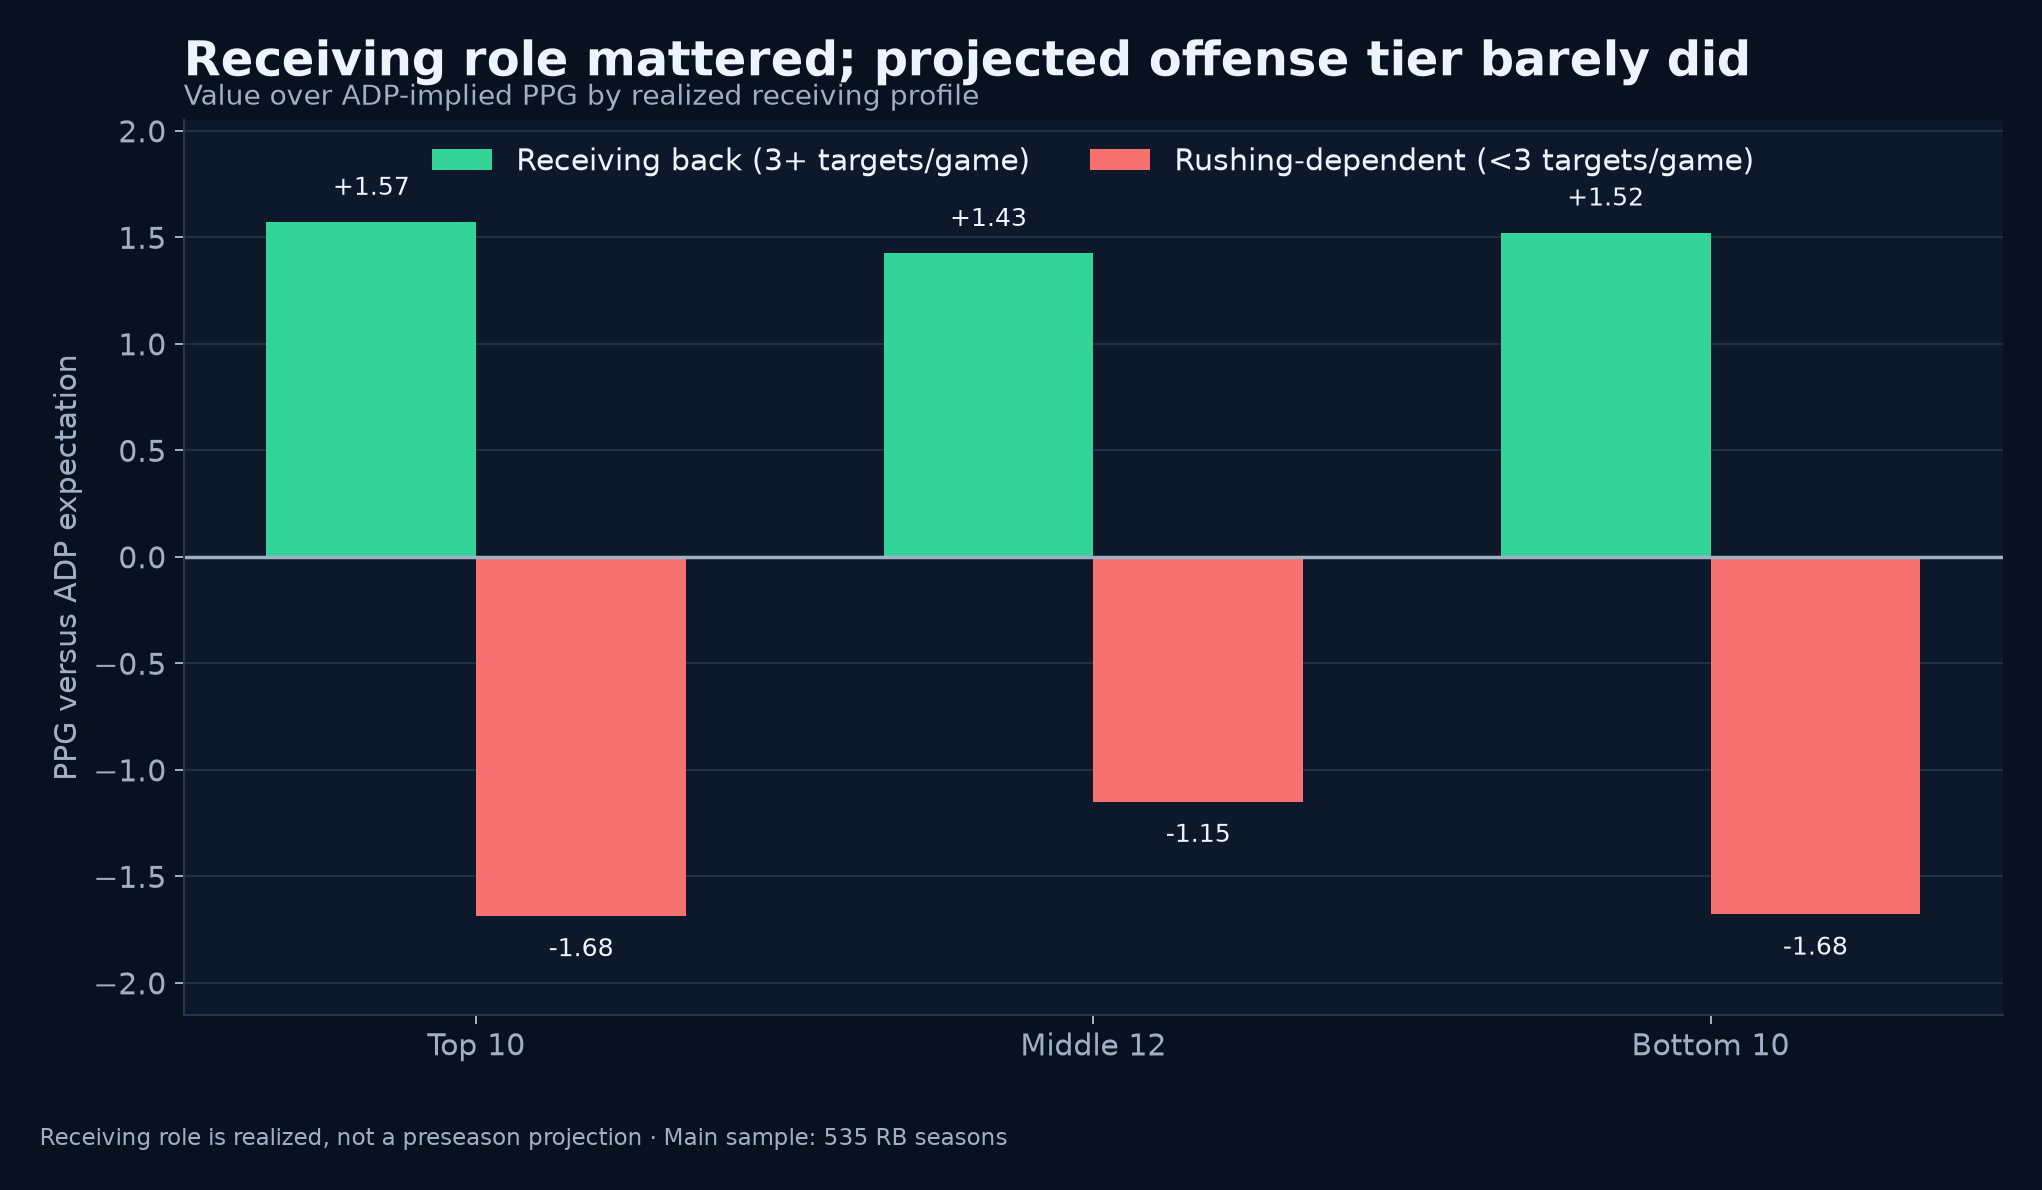
Running backs who actually reached at least three targets per game beat their ADP-based PPG expectations by:
- +1.57 PPG on projected top-10 offenses
- +1.52 PPG on projected bottom-10 offenses
Basically identical.
Meanwhile, rushing-dependent backs came in at approximately:
- −1.68 PPG on projected top-10 offenses
- −1.68 PPG on projected bottom-10 offenses
Again, basically identical.
The offense changed.
The result didn't.
Receiving backs beat expectations. Rushing-dependent backs missed them.
There is an important catch here: these are realized receiving roles, not perfectly known preseason roles. We cannot simply draft everyone who will eventually receive three targets per game because unfortunately the NFL refuses to provide us the season script in August.
So treat this as a mechanism test, not a magic drafting formula.
Still, the signal is hard to ignore.
Role separated the winners from the losers much more cleanly than projected team quality did. That fits the broader evidence behind where the running back dead zone begins: price and role interact more directly than a generic team label.
The nice offense is dessert.
Touches are dinner.
But Running Backs on Actually Great Offenses Crushed
Here is where fantasy football attempts to lure us back into the casino.
If we classify offenses using what actually happened during the season, the result is enormous.
RBs on actual top-10 scoring offenses produced a +2.05 PPG advantage over expectation versus backs on bottom-10 offenses.
That is not subtle.
It's also not particularly useful on draft night.
Actual top offenses averaged 12.82 PPG from their drafted backs. Actual bottom-10 offenses averaged 11.05.
The problem is that we don't know the actual best offenses in August.
Also, running backs scoring touchdowns and producing yards help make an offense good in the first place. So treating end-of-season offense rank as an independent preseason variable would be like predicting the winner of a poker tournament by checking who ended the night with the most chips.
Technically flawless.
Slight timing issue.
The Real Danger Was Being Wrong About the Offense
This might be the most actionable finding.
The biggest disaster wasn't drafting a player on an offense everyone already expected to be bad.
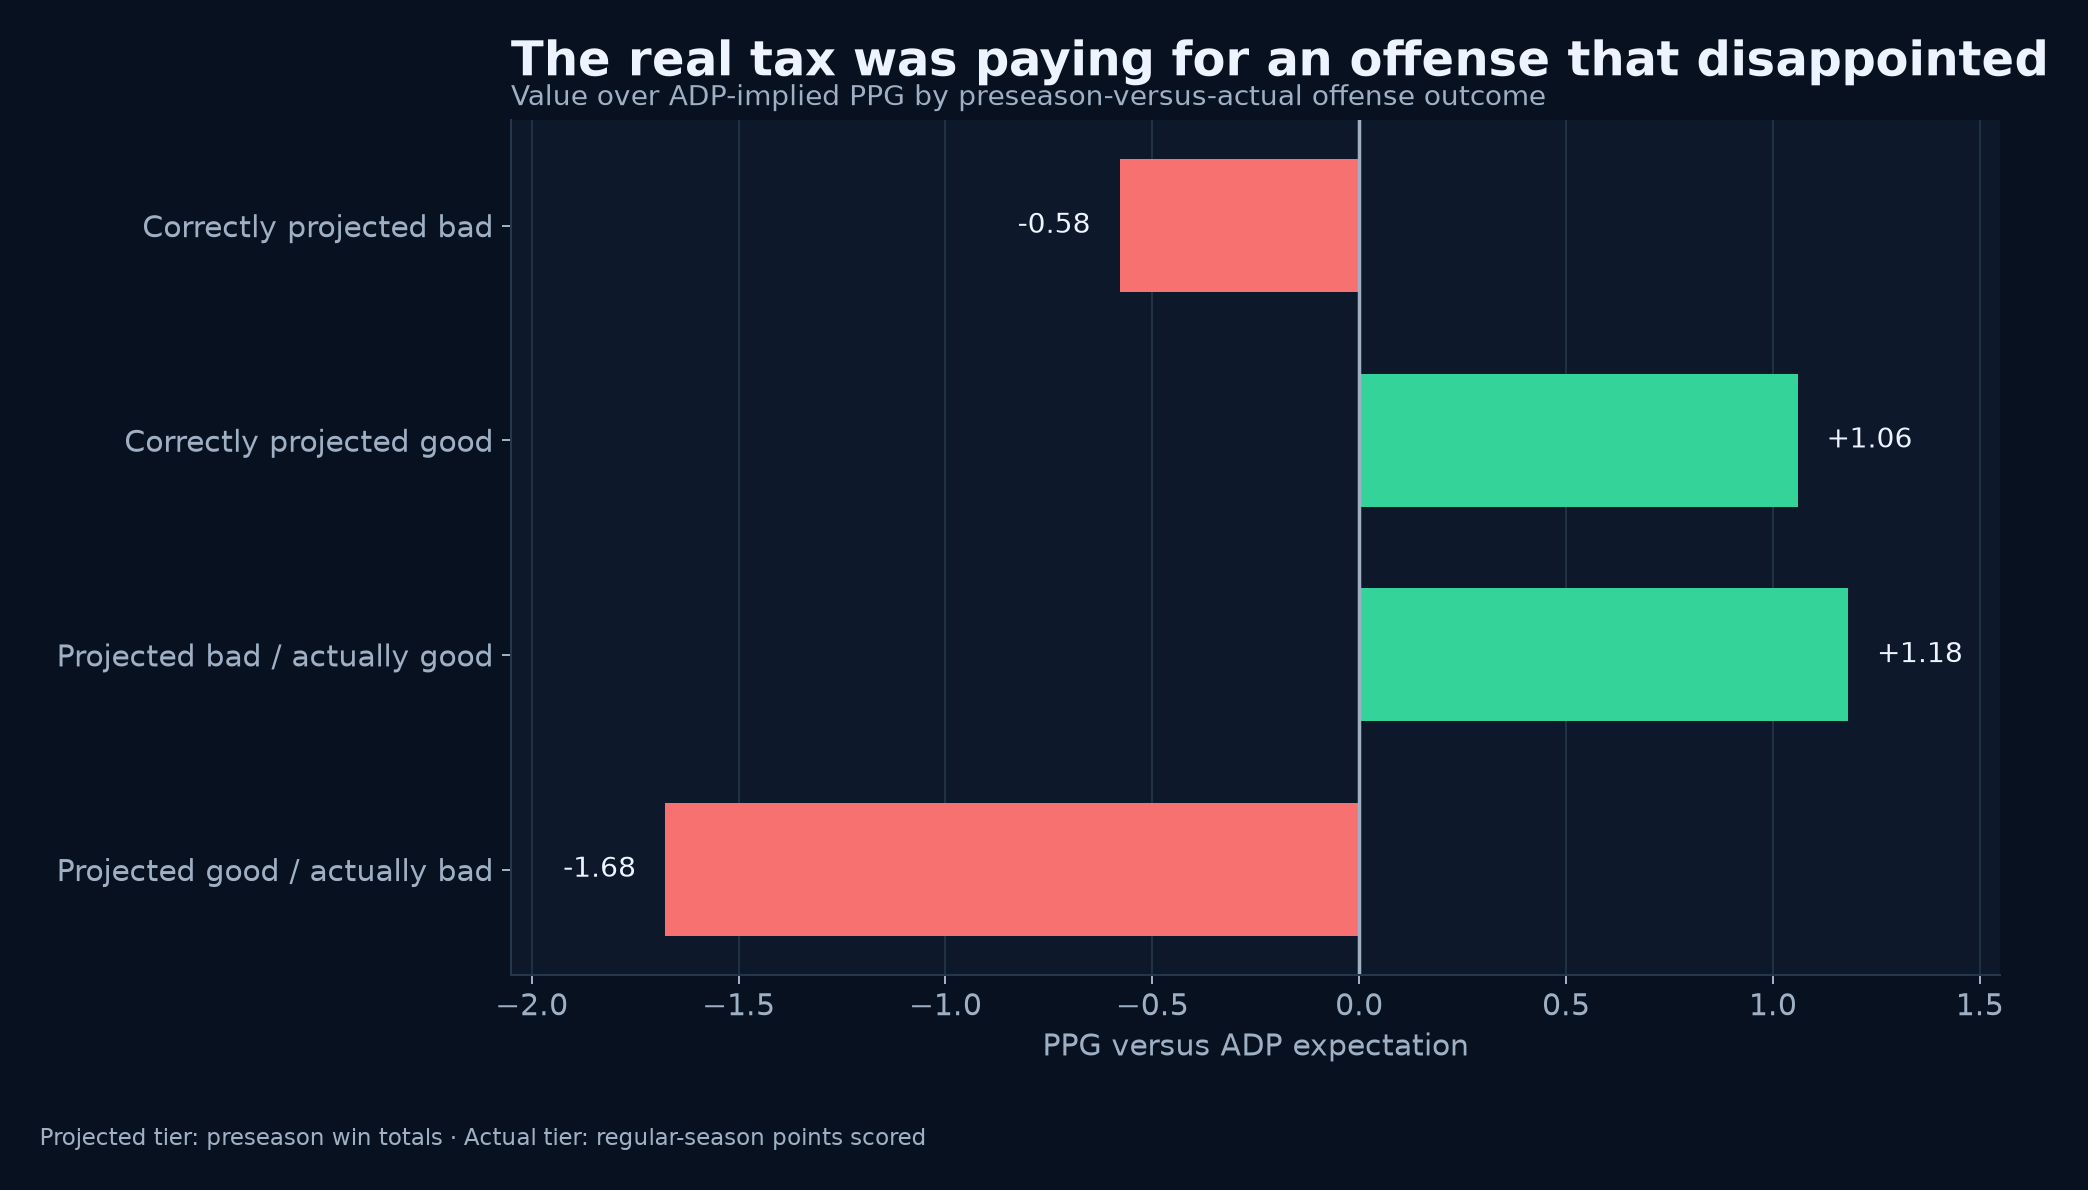
Those backs finished only 0.58 PPG below expectation.
The disaster was paying for a supposedly good offense that turned out to stink.
RBs on teams projected top 10 but finishing bottom 10 returned:
−1.68 PPG versus expectation.
Meanwhile, backs on projected bad offenses that unexpectedly became good returned +1.18 PPG.
That makes intuitive sense.
Surprise creates value.
Consensus does not.
Fantasy managers aren't punished simply because a team is bad. They're punished when they paid a premium for the team not to be bad.
We Even Tried Matching the Prices
Maybe the overall results were still hiding player-quality differences.
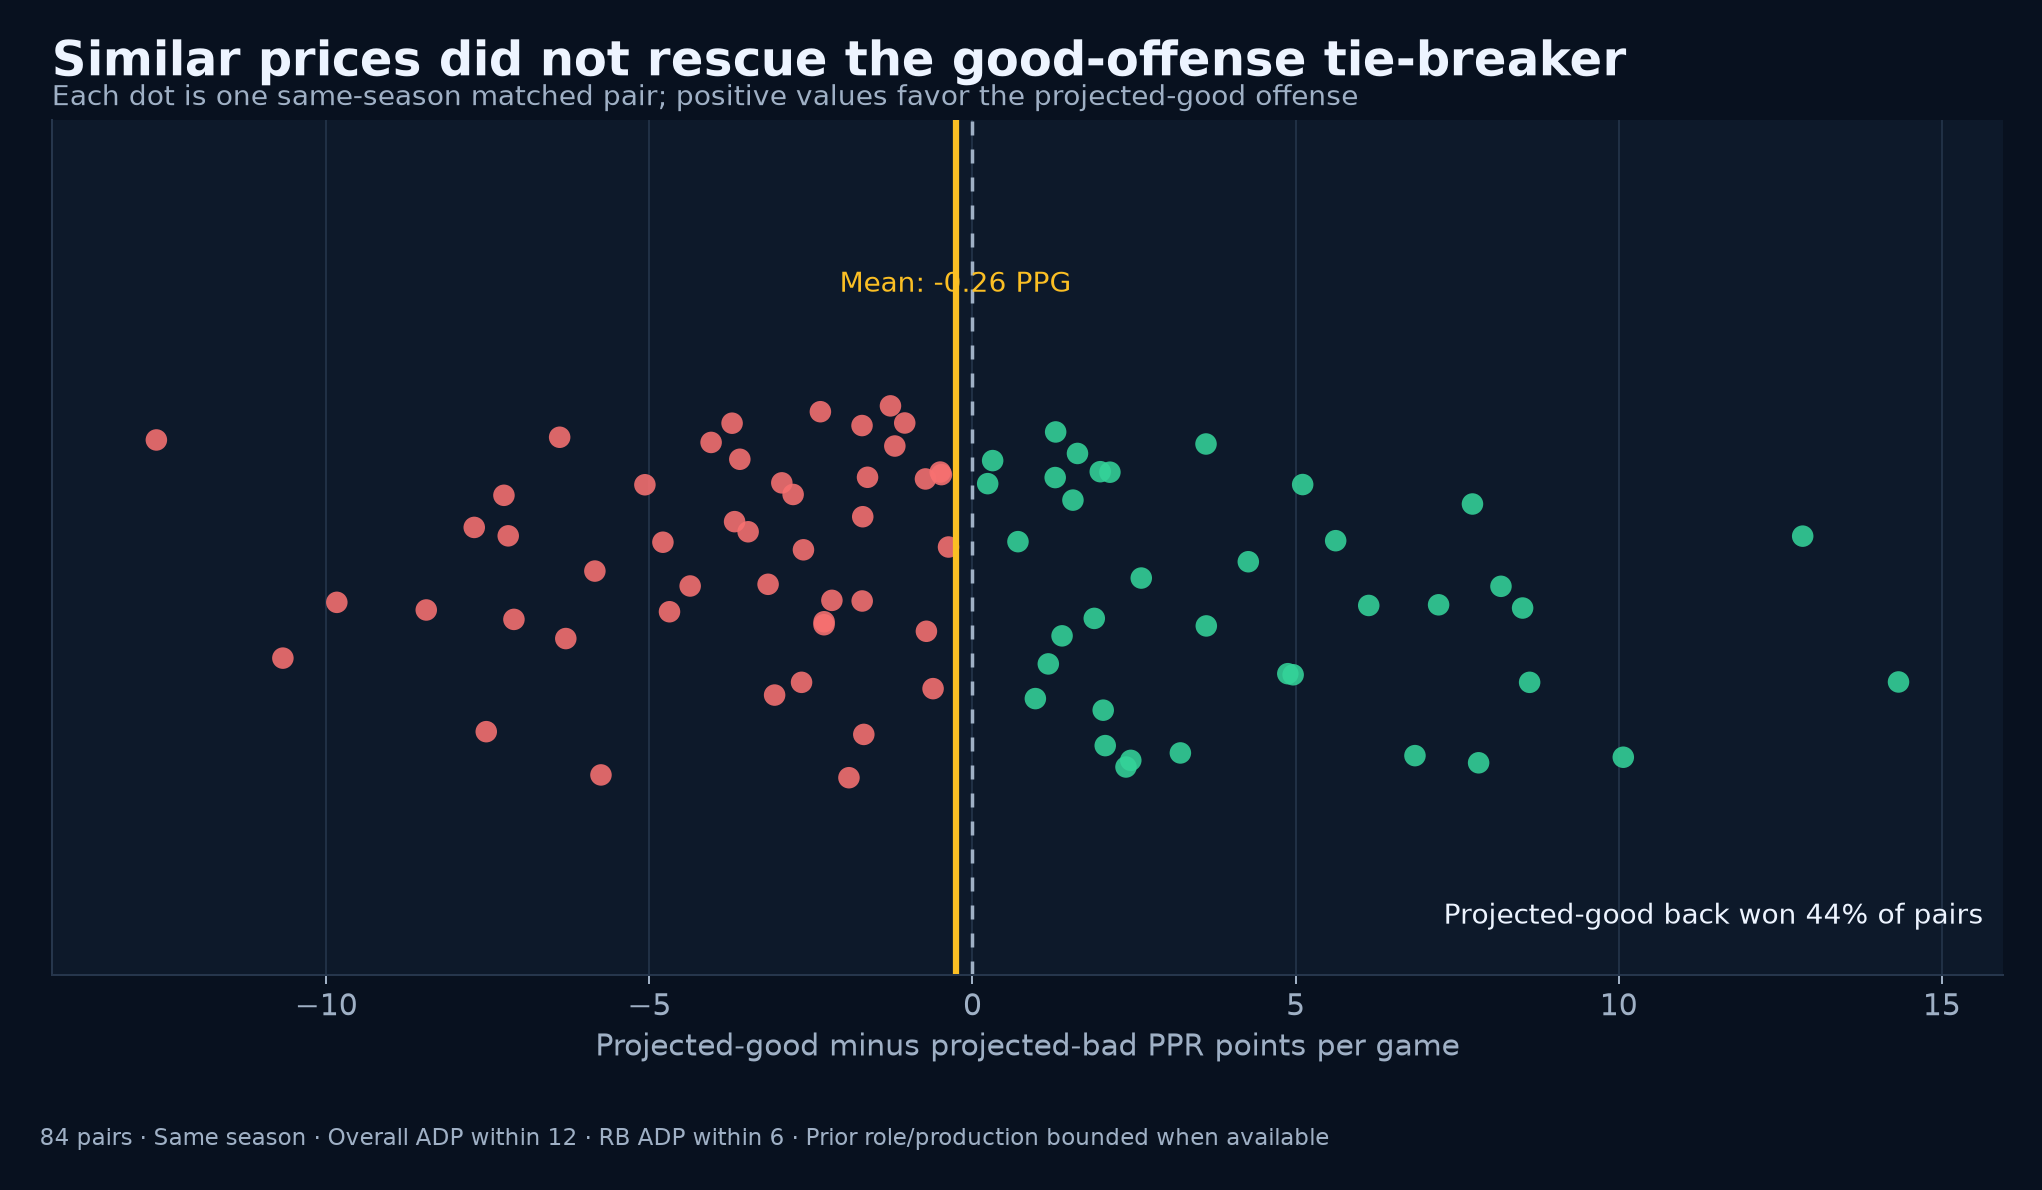
So the study created 84 matched pairs, comparing backs from projected top-10 and bottom-10 teams drafted within 12 overall picks and six positional spots, while also constraining prior production and opportunity when available.
Now we had something much closer to the actual question you face while drafting:
These two guys cost basically the same. Should I prefer the one on the better projected offense?
The projected-good side:
Lost by 0.26 PPG.
It lost by 0.37 PPG relative to expectation.
And the good-offense running back won the PPG comparison only 44% of the time.
Not exactly the tie-breaker we thought we were buying.
And We're Doing It Again in 2026
Look at the current fantasy market.
Jahmyr Gibbs is sitting around 1.01 in PPR ADP, while James Cook is another first-round RB attached to a Buffalo team carrying one of the league's highest win totals. Detroit and Buffalo are both around 10.5 wins in the current betting market.
But the market isn't blindly refusing backs on questionable teams either.
Bijan Robinson is essentially 1.02 despite Atlanta sitting around a 7.5-win total. De'Von Achane remains RB8 on the 2026 running back board even as Miami's betting win total sits around 4.5.
FantasyPros' season-long PPR projections have Gibbs at about 373 points and Bijan at 357, while Christian McCaffrey is projected for roughly 78 catches and Achane for about 65.
The market isn't asking only, Is this offense good?
It's asking what it should have been asking all along:
What does this player actually do inside it?
So What Should You Do Differently?
Don't downgrade a running back simply because his team might stink.
And don't upgrade another simply because his quarterback appears in nationally televised commercials.
If two backs have similar prices, role, receiving opportunity, workload security and talent should matter more than generic offensive optimism.
A strong offense can absolutely increase touchdown opportunity.
Our data shows that.
But if everyone in the draft room already knows the offense is good, there is a decent chance the advantage is sitting right there inside the ADP.
You don't get paid for discovering that Buffalo might score points.
Everyone received that email.
The opportunity comes when your view differs from the market: when you believe a supposedly bad offense is underrated, when a role is bigger than ADP assumes, or when receiving volume provides a scoring floor that team quality can't.
Good offenses are good for running backs.
They're just not automatically good deals.
And unfortunately, the second part is the one that wins fantasy leagues.
For a draft-ready version of that principle, use the 2026 Top 250 fantasy football cheat sheet and compare the price with the role before using offense quality as a tie-breaker.
The short version
- Projected top-10 offense RBs scored about 0.39 more PPG, but cost roughly seven more overall draft spots.
- After adjusting for ADP, the advantage became −0.19 PPG and was statistically indistinguishable from zero.
- Removing touchdowns erased essentially the entire raw projected-offense advantage.
- Receiving backs beat expectations by roughly +1.5 PPG regardless of offense quality; rushing-dependent backs missed by roughly −1.7.
- Actual great offenses produced major RB value, but knowing which offenses will actually be great is the whole problem.
- Draft the role. Draft the price. Don't pay twice for an offense everyone already loves.
Sources: Fantasy Football Calculator — 2015 PPR ADP; FantasyPros — archived PPR consensus ADP; Covers — historical NFL odds; nflverse data. Study notes: 535 drafted RB seasons, 2015–2025. The main offense proxy is preseason win-total rank, which captures overall team strength rather than a pure offensive projection. Results are descriptive, not causal, and are for informational and entertainment purposes only.